

Image Details
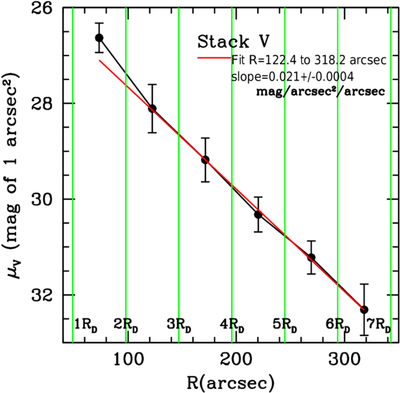
Caption: Figure 9.
Surface photometry of the stacked V image. The uncertainties are from a “jackknife” process described in the text. The green vertical lines mark the radii of the circles in units of the RD of the image. The surface brightness for an annulus is the average over the entire area of the annulus and is plotted as a black filled circle at the midpoint of the annulus. The red line is a linear fit to the second through sixth points and shows an exponential dropoff.
Other Images in This Article
Show More
Copyright and Terms & Conditions
© 2026. The Author(s). Published by the American Astronomical Society.

Copyright ©
2026 Astronomy Image Explorer. All Rights Reserved.
