Image Details
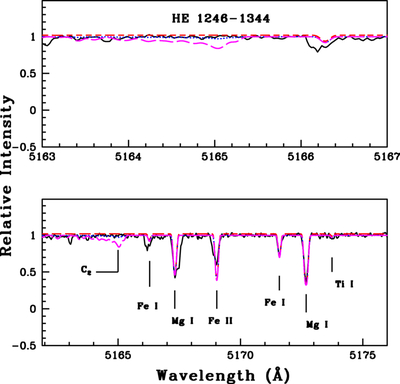
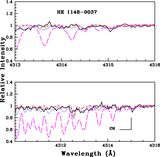
Caption: Figure 6.
Synthetic spectrum of the C2 band around 5165 Å. The black solid line represents the observed spectrum, while the blue dotted line shows the best-fit synthetic spectrum. The red short-dashed line and magenta long-dashed line correspond to synthetic spectra with Δ[C/Fe] = −0.2 and Δ[C/Fe] = +0.2, respectively. A zoomed-in view of the C2 band region is shown in the upper panel.
Other Images in This Article
Copyright and Terms & Conditions
© 2026. The Author(s). Published by the American Astronomical Society.
Copyright ©
2026 Astronomy Image Explorer. All Rights Reserved.