Image Details
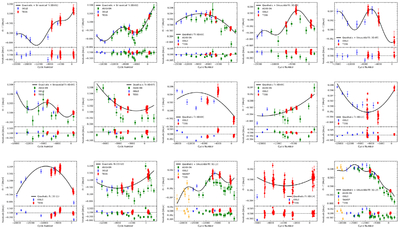
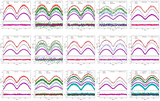
Caption: Figure 2.
The O − C diagrams for 15 targets with quadratic or sinusoidal+quadratic fit. The residuals of the best fit are shown in the lower panel of each plot. The ToM data for these targets are listed the Appendix.
Other Images in This Article
Copyright and Terms & Conditions
© 2026. The Author(s). Published by the American Astronomical Society.
Copyright ©
2026 Astronomy Image Explorer. All Rights Reserved.