Image Details
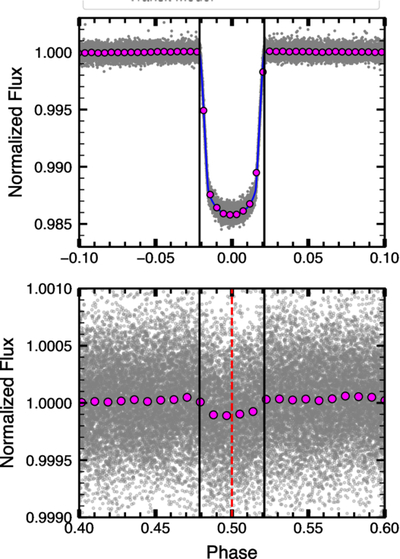
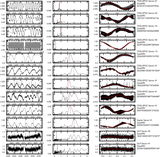
Caption: Figure 6.
Phase-folded TESS curves from the transit fitting process. Top panel: phase-folded light curve of the transit of KELT-20 (gray points), along with the binned data (purple points) and the transit model (blue curve). The black vertical lines display the t1 and t4 contact points of the transit. Bottom panel: phase-folded TESS light curve for the secondary eclipse of KELT-20 b. The red dashed line dictates the location of P/2, and the black vertical lines dictate the t1 and t4 contact points of the transit.
Other Images in This Article
Copyright and Terms & Conditions
© 2026. The Author(s). Published by the American Astronomical Society.
Copyright ©
2026 Astronomy Image Explorer. All Rights Reserved.