Image Details
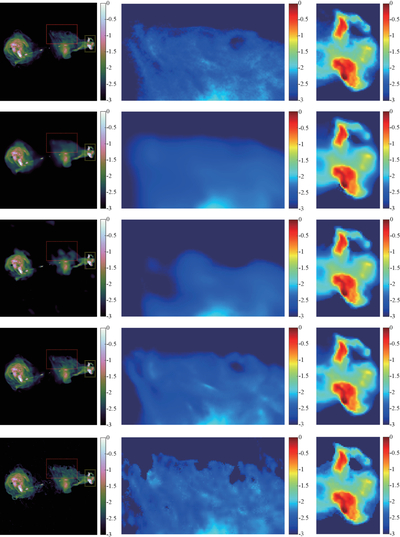
Caption: Figure 4.
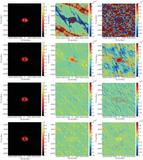
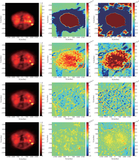
Zoomed-in views of faint and high-intensity emission regions in the reconstructed 3c353 images. From top to bottom, the rows present the ground truth and results of AIRI, LPG, R2D2 and GMCP, respectively. The first column displays the reconstructed images, with red rectangle highlighting the regions of faint emission and yellow rectangle highlighting the regions of high-intensity emission. The second and third columns show the zoomed-in views of faint and high-intensity emission regions, respectively.
Other Images in This Article
Copyright and Terms & Conditions
© 2026. The Author(s). Published by the American Astronomical Society.
Copyright ©
2026 Astronomy Image Explorer. All Rights Reserved.