Image Details
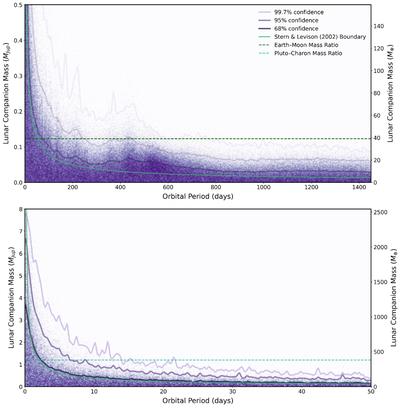
Caption: Figure 4.
Upper mass limits for a potential lunar companion to β Pic b as a function of the orbital period. The color is proportional to the density of MCMC posterior samples, and the solid curves indicate the 68%, 95%, and 99.7% confidence intervals. The upper panel covers longer orbital periods (≲1450 days, within the dynamical stability limit), where companions more massive than ∼0.5 MJup (∼60 M⊕) are excluded. The dashed line marks the Earth–Moon mass ratio scaled to β Pic b, and the solid green curve shows the moon/binary planet boundary from S. A. Stern & H. F. Levison (2002), which marks the theoretical separation between large moons and binary planetary systems based on mass ratios and orbital stability criteria. The lower panel zooms in on short orbital periods (≲50 days), where the constraints are weaker. The dashed line indicates the Pluto–Charon mass ratio, while the solid green curve again shows the S. A. Stern & H. F. Levison (2002) moon/binary planet boundary.
Other Images in This Article
Copyright and Terms & Conditions
© 2026. The Author(s). Published by the American Astronomical Society.