Image Details
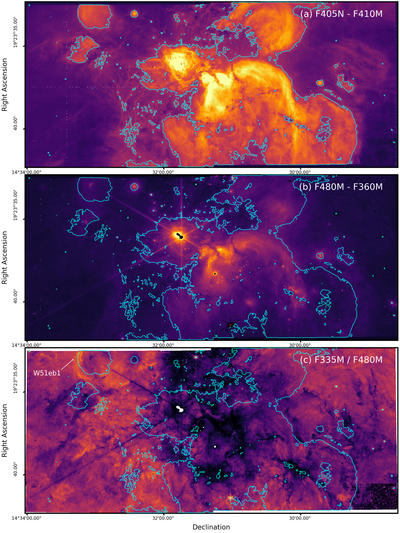
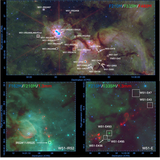
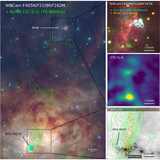
Caption: Figure 4.
Multiple color images of W51A region in a large-scale view. The images of F405N − F410M (top), F480M − F360M (middle), and F335M/F480M (bottom) are displayed to represent ionized gas, warm dust, and PAH abundance, respectively. The cyan contour marks the flux density of F405N − F410M image at 250 MJy sr−1.
Other Images in This Article
Copyright and Terms & Conditions
© 2026. The Author(s). Published by the American Astronomical Society.
Copyright ©
2026 Astronomy Image Explorer. All Rights Reserved.