Image Details
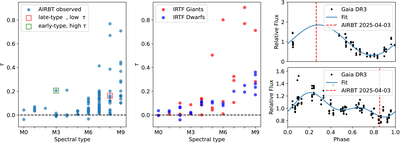
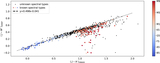
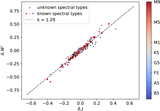
Caption: Figure 12.
Left: relationship between optical depth τ and spectral type from AIRBT known M-type stars. Square points mark 2 examples examined in right panel. Middle: results from IRTF spectral library separated into giants (red) and dwarfs (blue). Right panels: the upper part is the light curve of the M8 giant Gaia DR3 5255960181168967808, classified as a late-type star but showing a low optical depth; AIRBT observed it near the brighter phase (red dashed line); the lower part is the light curve of the M3 giant Gaia DR3 5335159343746430836, classified as an early-type star but showing a high optical depth; AIRBT observed it near the fainter phase (red dashed line).
Other Images in This Article
Show More
Copyright and Terms & Conditions
© 2026. The Author(s). Published by the American Astronomical Society.