Image Details
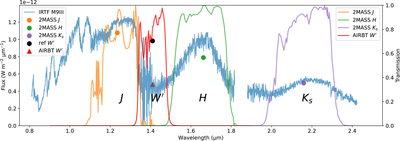
Caption: Figure 11.
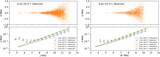
An example showing the calculation of optical depth τ. The blue line is a spectrum of an M9 giant BRIB1219-1336 from the IRTF spectral library, showing a water-vapor-absorption feature near 1.4 μm. The orange, green, and purple points are the J, H, and Ks fluxes converted from 2MASS magnitudes. The black point denotes the reference or continuum ﹩{W}^{{\prime} }﹩ flux from transformation, and the red triangle is the ﹩{W}^{{\prime} }﹩ flux obtained by convolving the spectrum with the filter transmission curve. The discrepancy between the expected ﹩{W}^{{\prime} }﹩ flux and the reference ﹩{W}^{{\prime} }﹩ flux reflects the water-vapor-absorption feature.
Other Images in This Article
Show More
Copyright and Terms & Conditions
© 2026. The Author(s). Published by the American Astronomical Society.