Image Details
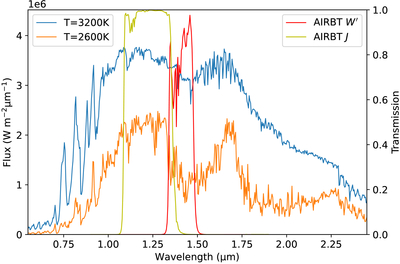
Caption: Figure 10.
Spectrum variability from the PHOENIX model with ﹩\mathrm{log}g=1﹩ and [M/H] = 0.0. The blue (orange) line shows spectra of a giant star with temperatures of 3200K (2600K), and the red (yellow) line is the transmission curve of the AIRBT ﹩{W}^{{\prime} }﹩ (J) filter. The ﹩{W}^{{\prime} }﹩ filter covers the water-vapor-absorption feature near 1.4 μm.
Other Images in This Article
Show More
Copyright and Terms & Conditions
© 2026. The Author(s). Published by the American Astronomical Society.
Copyright ©
2026 Astronomy Image Explorer. All Rights Reserved.