Image Details
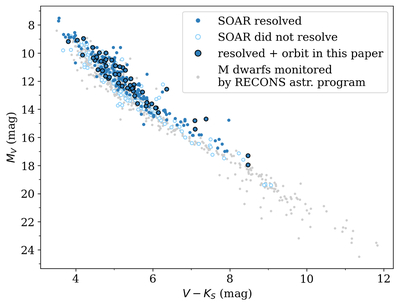
Caption: Figure 1.
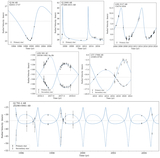
Color–magnitude diagram illustrating the distribution of targets in our sample with respect to the M dwarf main sequence. Each light- or dark-blue point is a pair that has been resolved at SOAR (filled dark-blue circles) or has been observed but not resolved (open light-blue circles); their photometry measurements are listed in E. H. Vrijmoet et al. (2022, Table 1). The 54 points circled in black are pairs for which an orbit is presented in this paper. To illustrate the rest of the low-mass main sequence, these points are overlaid on M and L dwarfs within 25 pc (light-gray points) from the RECONS astrometry program (T. J. Henry et al. 2018).
Other Images in This Article
Copyright and Terms & Conditions
© 2026. The Author(s). Published by the American Astronomical Society.