Image Details
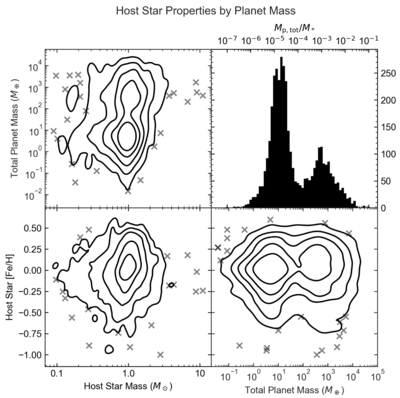
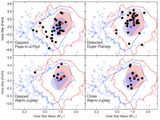
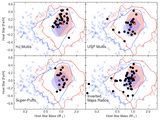
Caption: Figure 2.
Masses and metallicities of the exoplanet host star population compared with the total planet mass in each system. Top left, bottom left, and bottom right are density contour plots where each contour corresponds to 0.5σ, with the outermost contour being 2.5σ, or 99% of host stars. Outlier systems are marked with X’s. Top right is a histogram of mass ratios of total planet mass divided by host mass.
Other Images in This Article
Copyright and Terms & Conditions
© 2026. The Author(s). Published by the American Astronomical Society.
Copyright ©
2026 Astronomy Image Explorer. All Rights Reserved.