Image Details
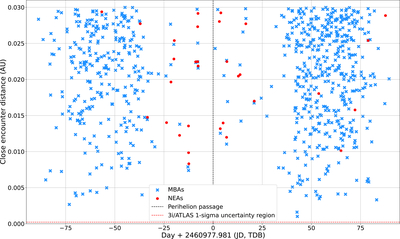
Caption: Figure 1.
Time and distance of all identified close encounters (<0.03 au) between 3I and populations of NEAs (red dots) and MBAs (blue crosses). The x-axis represents time in days relative to 3I’s perihelion passage, which is marked by the vertical black dashed line at Day 0. Despite the propagation of 3I orbital motion and analysis are made on the time period from 2025 August 1, until 2026 April 1 the plot displays distribution over 2025 August 1, (JD 2460888.5) until 2026 February 10 (JD 2461081.5) as there are no identified close encounters within 0.03 au in the next dates. The horizontal red dashed line indicates the 1σ positional uncertainty of 3I’s nominal orbit (2.20 × 10⁻⁴ au), providing a scale for comparison.
Other Images in This Article
Copyright and Terms & Conditions
© 2026. The Author(s). Published by the American Astronomical Society.