Image Details
Caption: Figure 1.
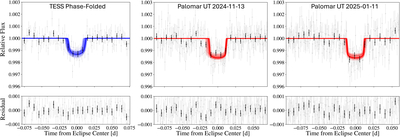
Phased-folded and 2 minute binned TESS light curve (left panel) and detrended Palomar/WIRC light curves (middle and right panels) for the two transit observations of TOI-2267 d. Residuals after the best-fit transit light curve model has been subtracted are shown in the lower panels. Unbinned data are shown as gray circles, with 10 minute binned points overplotted as black circles. The best joint-fit transit models are overplotted as blue lines for the TESS data, and red lines for the Palomar data, with 100 random draws from the posterior distribution to illustrate the typical model uncertainty. All detrended light curves are available electronically as data behind the figure.
(The data used to create this figure are available in the online article.)
(The data used to create this figure are available.)
Other Images in This Article
Copyright and Terms & Conditions
© 2026. The Author(s). Published by the American Astronomical Society.