Image Details
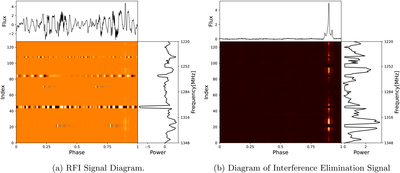
Caption: Figure 15.
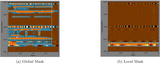
Comparison chart before and after interference elimination. Panel (a) shows the ultra-wideband pulsar data affected by a variety of RFIs. There are a variety of RFIs in different channel ranges, so that the true pulsar signal is masked. It is the input data of the RFI-MN structure. Panel (b) presents the RFI-labeled and classified data after interference suppression—the core objective of this study, which aims to mitigate the impact of RFI on astronomical data and provide clean data for subsequent scientific research.
Other Images in This Article
Show More
Copyright and Terms & Conditions
© 2026. The Author(s). Published by the American Astronomical Society.
Copyright ©
2026 Astronomy Image Explorer. All Rights Reserved.