Image Details
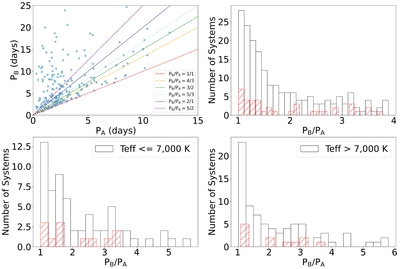
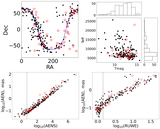
Caption: Figure 10.
Upper left panel: measured periods of the A and B binaries of all 250 quadruple candidates in the TGV catalog, compared to several integer ratios of PB/PA. Upper right panel: corresponding period ratios PB/PA, such that PA < PB. The black histogram represents all 250 targets in the TGV catalog, and the red histogram—the 52 presented here. Lower panels: same as upper right panel but separated for targets with Teff <7000 K (left) and Teff >7000 K (right). The panels are meant for comparison with Figure 16 from P. Zasche et al. (2023).
Other Images in This Article
Show More
Copyright and Terms & Conditions
© 2025. The Author(s). Published by the American Astronomical Society.
Copyright ©
2025 Astronomy Image Explorer. All Rights Reserved.