Image Details
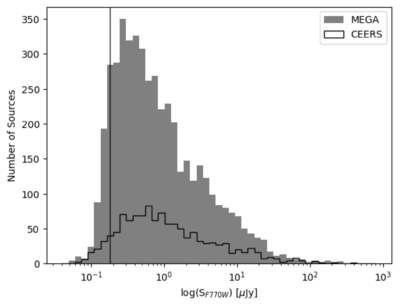
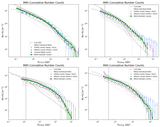
Caption: Figure 4.
Distribution of F770W photometric fluxes for our MEGA survey sample compared to 5σ CEERS detections. The vertical dashed line represents our 5σ image depth for the F770W filter.
Other Images in This Article
Copyright and Terms & Conditions
© 2025. The Author(s). Published by the American Astronomical Society.
Copyright ©
2025 Astronomy Image Explorer. All Rights Reserved.