Image Details
Caption: Figure 1.
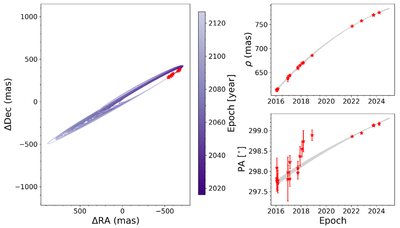
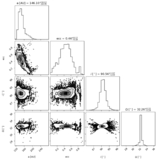
Orbit fit for HR 2562 B. The leftmost plot displays 100 randomly selected orbits, color-coded to illustrate the anticipated orbital position over time. The right panels present the measured separation and position angle as a function of time, compared to the randomly drawn orbits (in gray). Red stars represent the observations. The apparent position angle discrepancy observed between 2018 and 2020 is likely due to systematic effects inherent to GPI astrometry.
Other Images in This Article
Copyright and Terms & Conditions
© 2025. The Author(s). Published by the American Astronomical Society.
Copyright ©
2025 Astronomy Image Explorer. All Rights Reserved.