Image Details
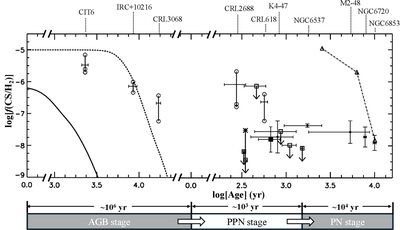
Caption: Figure 2.
Fractional abundance of CS as a function of the dynamical age of the CSEs. The filled and open squares denote the 21 μm sources with and without CS detection, respectively. These data points have been artificially shifted slightly for the sake of clarity. The filled circles denote the PNe investigated by J. L. Edwards et al. (2014). The open circles linked by straight lines denote the AGB CSEs and PPNe investigated in the literature listed in Table 2. The solid and dashed curves represent the calculated results from Model 1 and Model 2 (see the text), respectively. The open triangles linked by dashed-dotted line are the calculated results of the clumpy model for PNe at the dynamical ages of 2550, 6300, and 10,050 yr (M. P. Redman et al. 2003). The vertical dashed lines mark the dynamical ages and source names of the comparison sample. The asterisk denotes the fractional abundance of CS in IRAS 22272+5435 calculated from the observations reported in Y. Zhang (2020), and this value is connected to our results by a straight line for visual comparison.
Other Images in This Article
Copyright and Terms & Conditions
© 2025. The Author(s). Published by the American Astronomical Society.