Image Details
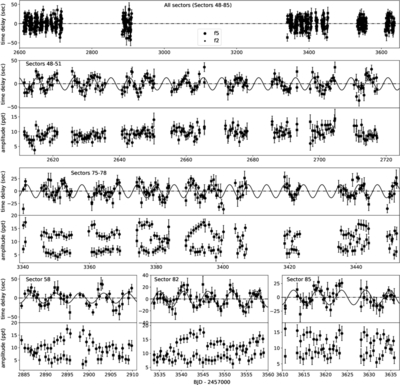
Caption: Figure 6.
Pulsation timing analysis of TIC 202354658 using f5 (the largest amplitude pulsation—shown in “•”) and f2 (the second largest amplitude pulsation—shown in “■”). (Row1) Pulsation timing analysis of all available sectors, Sectors 48–51, 58, 75–78, 82, and 85. (Row2–4: top) The pulsation timing analysis of each sector. The solid curve shows the best-fit sinusoid. (Row2–4: bottom) The pulsation amplitude variations of each sector.
(The data used to create this figure are available in the online article.)
(The data used to create this figure are available.)
Other Images in This Article
Copyright and Terms & Conditions
© 2025. The Author(s). Published by the American Astronomical Society.
Copyright ©
2026 Astronomy Image Explorer. All Rights Reserved.