Image Details
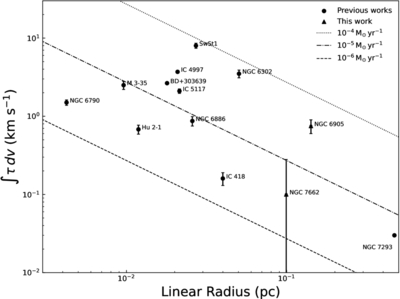
Caption: Figure 3.
Integrated H I optical depth vs. linear radius of the ionized regions. The diagonal lines represent the results derived from theoretical calculations based on different mass-loss rates (as shown in the upper right corner).
Other Images in This Article
Copyright and Terms & Conditions
© 2025. The Author(s). Published by the American Astronomical Society.
Copyright ©
2026 Astronomy Image Explorer. All Rights Reserved.