Image Details
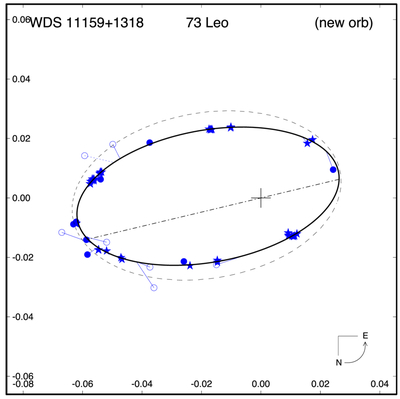
Caption: Figure 4.
The new combined orbit solution: plot of relative astrometry data for 73 Leo; the X and Y scales are in arcseconds. The dashed curve represents the orbit of B. D. Mason et al. (1997). The dotted–dashed line indicates the line of nodes. Early speckle measurements (1979–1993) are shown as open circles, NPOI measures as stars, and later speckle measures (2018–2025) as filled circles. All measurements are connected to their predicted positions on the orbit by “O − C” lines. The direction of motion is indicated on the northeast orientation in the lower right of the plot.
Other Images in This Article
Copyright and Terms & Conditions
© 2025. The Author(s). Published by the American Astronomical Society.
Copyright ©
2025 Astronomy Image Explorer. All Rights Reserved.