Image Details
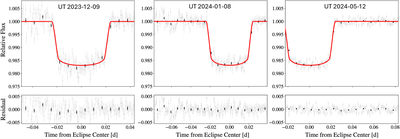
Caption: Figure 1.
Detrended Palomar/WIRC light curves for the three transit observations of LP 791-18 c (upper panels) and residuals after the best-fit transit light curve has been subtracted (lower panels). Unbinned data are shown as gray circles, with 10 minute binned points overplotted as black circles. The best joint-fit transit models are overplotted as red lines, with red shading to indicate the 1σ uncertainties on the transit shape.
Other Images in This Article
Copyright and Terms & Conditions
© 2025. The Author(s). Published by the American Astronomical Society.
Copyright ©
2025 Astronomy Image Explorer. All Rights Reserved.