Image Details
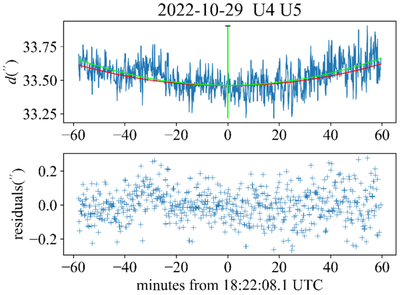
Caption: Figure 1.
The distance curve of a valid mutual approximation event. In the upper frame, the blue curve is the observed distance between U4 and U5, the green curve is the fitted one, and the red curve is obtained from the JPL ephemeris (DE440+URA111). The green and red vertical lines are the central instant of the fitted curve and the ephemeris curve. The black horizontal line at the top of the green vertical line denote the ﹩{\sigma }_{{t}_{0}}﹩ mentioned in Table 3. In the lower frame, the scatters marked with “+” are the residuals of the observed data and the fitted curve.
Other Images in This Article
Copyright and Terms & Conditions
© 2025. The Author(s). Published by the American Astronomical Society.
Copyright ©
2025 Astronomy Image Explorer. All Rights Reserved.