Image Details
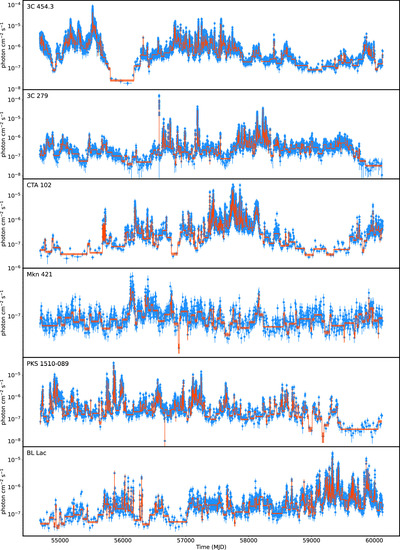
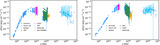
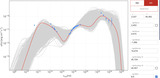
Caption: Figure 2.
γ-ray light curves of selected sources shown together with their Bayesian blocks binning. This illustrates the large flux variability of blazars as well as the intervals selected for spectral analysis, which follow the blazar temporal variability.
Other Images in This Article
Copyright and Terms & Conditions
© 2024. The Author(s). Published by the American Astronomical Society.
Copyright ©
2026 Astronomy Image Explorer. All Rights Reserved.