Image Details
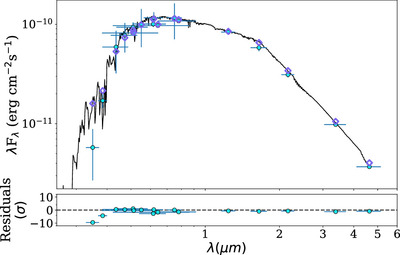
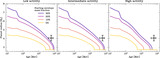
Caption: Figure 3.
Stellar spectral energy distribution with an ATLAS9 model (T eff = 5000 K, [Fe/H] = 0 dex, log(g) = 4 dex) overlaid. Individual points represent photometric data from the Gaia DR2 Crossmatch Catalog. Horizontal errors denote the bandpass widths.
Other Images in This Article

Copyright and Terms & Conditions
© 2024. The Author(s). Published by the American Astronomical Society.
Copyright ©
2025 Astronomy Image Explorer. All Rights Reserved.