Image Details
Caption: Figure 3.
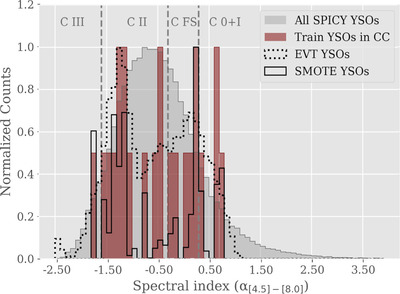
The spectral indices for the YSOs which form the basis for our training set (maroon), an example of how the EVT method (dotted black line) or SMOTE method (solid black line) of data augmentation can cause variation in spectral index, and the full range of spectral indices throughout the entire SPICY catalog (gray), normalized for comparison. Gray dashed lines indicate the typical cuts in spectral index applied to separate classes (e.g., Dunham et al. 2015; Kuhn et al. 2021). The associated class labels are also marked above their respective regions (Class II ≡ “C II”).
Other Images in This Article

Show More
Copyright and Terms & Conditions
© 2024. The Author(s). Published by the American Astronomical Society.
Copyright ©
2026 Astronomy Image Explorer. All Rights Reserved.