Image Details
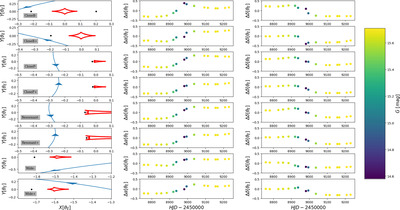
Caption: Figure 5.
(Left) The source trajectories (blue), caustics (red) and critical curves (black) for the eight models. Note that the center of mass of the lenses is kept fixed at (0,0). The microlensing astrometric deflections in R.A. (middle) and in decl. (right) vs. time are also displayed. The color indicates the observed Gaia G magnitude.
Other Images in This Article


Copyright and Terms & Conditions
© 2024. The Author(s). Published by the American Astronomical Society.
Copyright ©
2026 Astronomy Image Explorer. All Rights Reserved.