Image Details

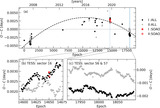
Caption: Figure 10.
The trailed line profiles of the Ca II H and K (a) and Hα (b) excess emission spectra. The light and dark gray spectra were observed on 2019 September 13 and 15, respectively. The RV curves of Stars 1 and 2 are drawn as dashed blue and solid red lines, respectively. The number on the right side corresponds to the phase of the spectrum.
Other Images in This Article


Show More
Copyright and Terms & Conditions
© 2024. The Author(s). Published by the American Astronomical Society.
Copyright ©
2024 Astronomy Image Explorer. All Rights Reserved.