Image Details
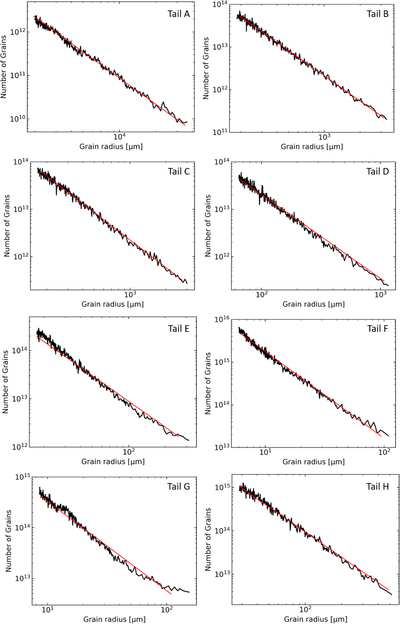
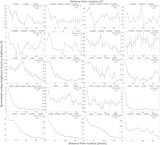
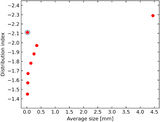
Caption: Figure 5.
The number of particles vs. grain radius (black lines). The number of grains is integrated across the whole tail in the direction perpendicular to the tail in the photometry aperture. The red lines are linear fit to the dust size distributions, and the power indices of the distribution functions are, for Tails A to H, −2.29, −1.97, −1.88, −1.78, −1.57, −2.11, −1.45, and −1.67, respectively.
Other Images in This Article
Copyright and Terms & Conditions
© 2023. The Author(s). Published by the American Astronomical Society.
Copyright ©
2026 Astronomy Image Explorer. All Rights Reserved.