Image Details
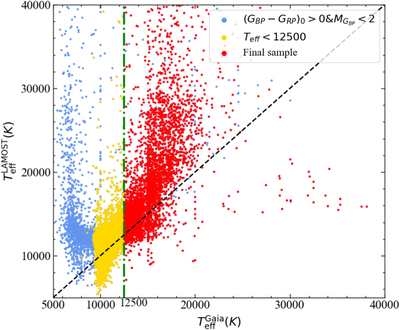
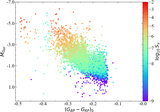
Caption: Figure 2.
Comparison of T eff derived by Gaia/DR3 and LAMOST. The blue dot denotes the objects we filtered out by ﹩{({G}_{\mathrm{BP}}-{G}_{\mathrm{RP}})}_{0}\gt 0﹩ and ﹩{M}_{{{\rm{G}}}_{\mathrm{BP}}}\lt 2﹩. The yellow dot denotes the objects that pass photometry screening; however, T eff is lower than 12,500 K and therefore removed as well. The red dot denotes the stars for which we finally calculate the radio flux.
Other Images in This Article
Copyright and Terms & Conditions
© 2023. The Author(s). Published by the American Astronomical Society.
Copyright ©
2025 Astronomy Image Explorer. All Rights Reserved.