Image Details
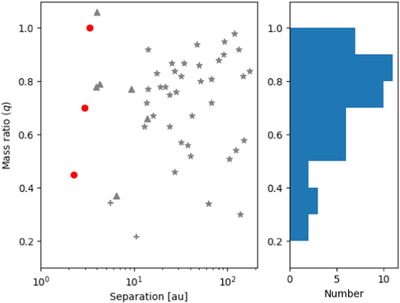
Caption: Figure 7.
Left: mass ratio (q) vs. separation diagram of the resolved companions in this study (red; only those whose mass ratios we estimated) overlaid with other imaging studies (gray). The stars, triangles, and plus signs correspond to Biller et al. (2022), Calissendorff et al. (2022) and De Furio et al. (2022a, 2022b), respectively. We adopted the semimajor axes derived from orbital fitting for the companions in Calissendorff et al. (2022) and Biller et al. (2022 ) and the projected separations for the resolved companions in this study and De Furio et al. (2022a, 2022b). Right: histogram of the mass ratios of the companions in the left panel.
Other Images in This Article


Copyright and Terms & Conditions
© 2023. The Author(s). Published by the American Astronomical Society.