Image Details
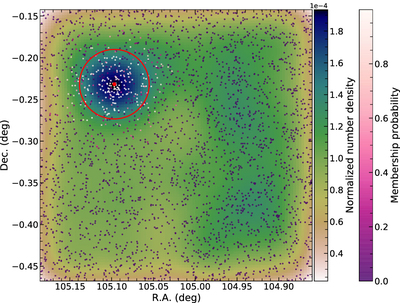
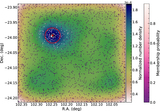
Caption: Figure 6.
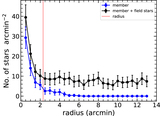
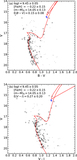
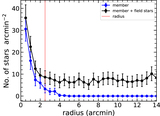
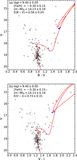
Distribution function of the stellar photometry data from the B-band image including Berkeley 34. Black dots are the locations of stars without consideration of their brightnesses, and the red dot indicates the center of Berkeley 34 obtained from Gaussian fitting. The red circle indicates the radius ﹩2\buildrel{\,\prime}\over{.} 5﹩ of Berkeley 34. The white-magenta dot symbols are the members of Berkeley 34. The left color bar shows values of the normalized number density function and the right color bar the membership probability for each star.
Other Images in This Article
Show More
Copyright and Terms & Conditions
© 2023. The Author(s). Published by the American Astronomical Society.
Copyright ©
2026 Astronomy Image Explorer. All Rights Reserved.