Image Details
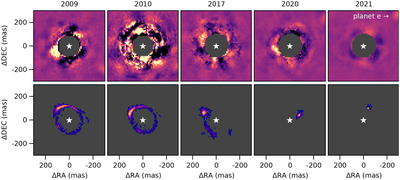
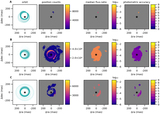
Caption: Figure 9.
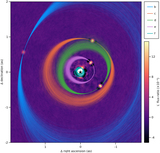
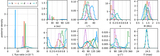
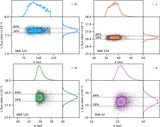
Top: images from each of the five epochs. Bottom: 2D marginal position posterior at each epoch. This shows the a posteriori most likely positions for an inner planet at each epoch. Note that the posterior is calculated jointly from all images; this figure merely visualizes it at individual epochs. Even epochs where the location is poorly constrained can still contribute to the S/N of the model as a whole by reducing the space of plausible orbits and planet photometry.
Other Images in This Article
Show More
Copyright and Terms & Conditions
© 2022. The Author(s). Published by the American Astronomical Society.
Copyright ©
2026 Astronomy Image Explorer. All Rights Reserved.