Image Details
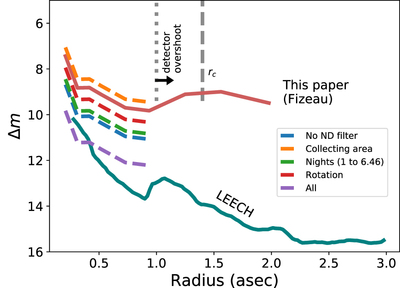
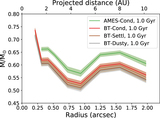
Caption: Figure 9.
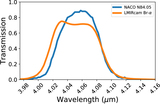
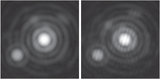
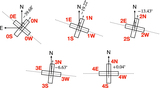
The Δm contrast curve for Altair in the regime ρ ≳ λ/D with total integration time in Fizeau mode of ﹩{t}_{{\rm{int}}}=445\,{\rm{s}}﹩ for most azimuths around Altair. The dotted line indicates the radius corresponding to the edge of the detector readout for a subset of the frames, effectively reducing the integration time to ﹩\approx 130\,{\rm{s}}﹩ for a region to the southeast of Altair. The dashed line indicates the AO control radius, beyond which the AO correction is expected to deteriorate due to Nyquist spatial sampling limitations. Seeing was 0.9″–1.4″, and the parallactic angle change was Δq = 33°. (See Tables 1 and 2). A contrast curve for Altair from the direct imaging LEECH survey is also shown, obtained with one of the two LBT sub-telescopes, with λ C = 3.8 μm, ﹩{t}_{{\rm{int}}}=2873\,{\rm{s}}﹩, seeing ∼0.9”, and Δq = 83°. (J. Stone, personal communication)
Other Images in This Article
Show More
Copyright and Terms & Conditions
© 2022. The Author(s). Published by the American Astronomical Society.