Image Details
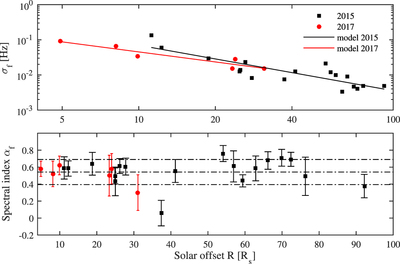
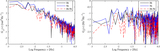
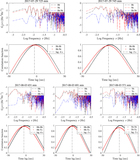
Caption: Figure 3.
The rms intensity of the frequency fluctuations and spectral index vs. solar offset distance. The circles represent the data from 2015 and the dots represent the data from 2017.
Other Images in This Article
Show More
Copyright and Terms & Conditions
© 2021. The American Astronomical Society. All rights reserved.
Copyright ©
2026 Astronomy Image Explorer. All Rights Reserved.