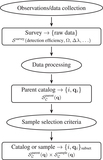
Image Details
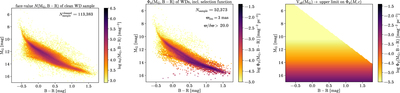
Caption: Figure 8.
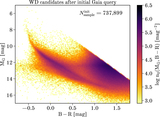
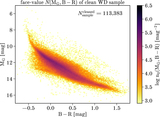
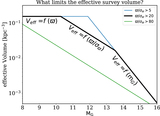
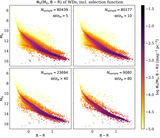
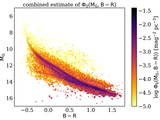
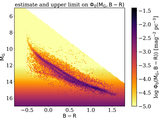
Comparison of the cleaned sample of likely WDs, ﹩{N}_{{ \mathcal C }}({M}_{G},(B-R))﹩ (left, with units [mag−2 ]) with the modeled white dwarf LCF, Φ0(MG, (B − R)) (center, with units [mag−2 pc−3]). The (MG, (B − R)) domain covered by both distributions is of course the same. Yet, the density peaks of ﹩{N}_{{ \mathcal C }}({M}_{G},(B-R))﹩ and of Φ0(MG, (B − R)) are in dramatically different places in the (MG, (B − R)) plane. The reason is that the two distributions differ by the selection function integral (expressed here via Veff), which is shown in the right panel; in the case at hand the selection function ends up being only a function of MG, not (MG, (B − R)); the survey volume in the top-right corner of the (MG, (B − R)) plane is zero, as such objects were excluded by the initial Gaia parent catalog query.
Other Images in This Article


Copyright and Terms & Conditions
© 2021. The Author(s). Published by the American Astronomical Society.