Image Details
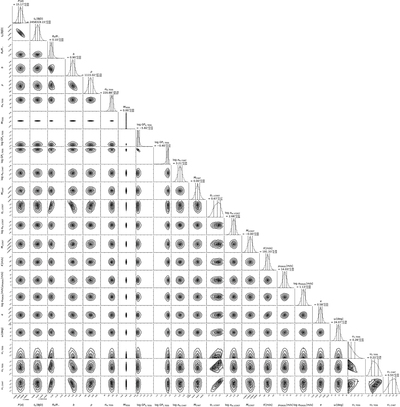
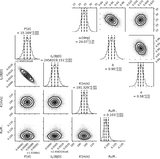
Caption: Figure 8.
Corner plot showing the posteriors of all parameters in our joint fit. The stated values represent 16th, 50th, and 84th percentiles, and we consider the median our best fit. Individual sample points are not drawn to limit file size.
Other Images in This Article
Copyright and Terms & Conditions
© 2020. The American Astronomical Society. All rights reserved.
Copyright ©
2026 Astronomy Image Explorer. All Rights Reserved.