Image Details

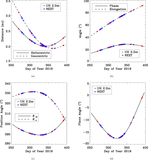
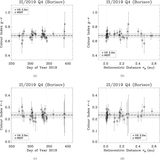
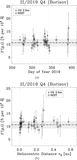
Caption: Figure 5.
The reduced r-band magnitude of interstellar comet 2I/2019 Q4 (Borisov), ﹩{m}_{r}\left(1,1,\alpha \right)﹩, vs. the phase angle α. Data points from the two observatories are plotted as different symbols, as indicated in the legend in the lower left corner of the figure. Preperihelion and postperihelion data points are in blue and dark red, respectively. The gray dashed–dotted line is the best linear least-squares fit to all of the r-band data, and the the less steep dashed line is the best fit to the preperihelion counterparts (see Table 2).
Other Images in This Article
Copyright and Terms & Conditions
© 2020. The American Astronomical Society. All rights reserved.
Copyright ©
2026 Astronomy Image Explorer. All Rights Reserved.