Image Details
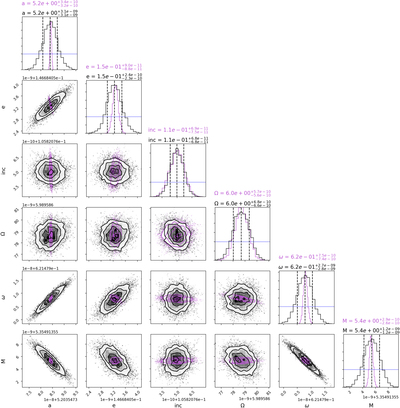
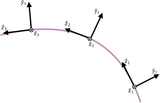
Caption: Figure 8.
Corner plot showing the distribution of walkers after burn-in for each orbital element after five occultations taken with a 1 yr spacing. The 16th, 50th, and 84th percentiles of the marginalized posterior probability distribution functions are displayed as dotted lines. In purple, we also include the posteriors where five occultations are instead taken at evenly spaced intervals across the ∼12 yr Trojan orbit. The blue lines in each histogram display the Gaussian distributions associated with the initial orbital element uncertainties prior to any occultation measurements. The original uncertainties were all improved by over an order of magnitude; as a result, the blue distributions appear flat on this scale. This plot was created using the corner Python package (Foreman-Mackey 2016).
Other Images in This Article
Show More
Copyright and Terms & Conditions
© 2019. The American Astronomical Society. All rights reserved.