Image Details
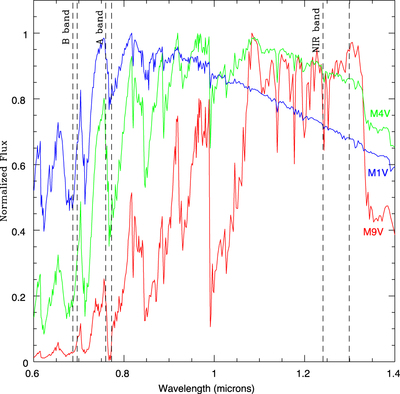
Caption: Figure 3.
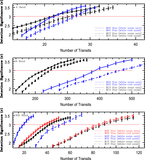
Husser et al. (2013) model emission spectra for M1V, M4V, and M9V stars. The resolution of the models has been binned down to R = 3000 for a clearer display. The vertical dashed lines highlight the location of the O2 B, A, and NIR bands.
Other Images in This Article
Copyright and Terms & Conditions
© 2019. The American Astronomical Society. All rights reserved.
Copyright ©
2026 Astronomy Image Explorer. All Rights Reserved.