Image Details
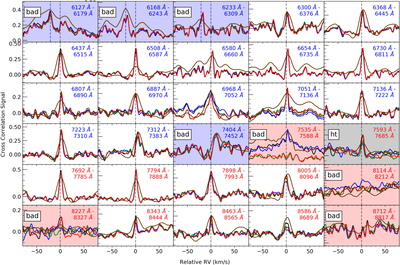
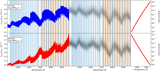
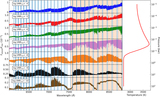
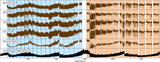
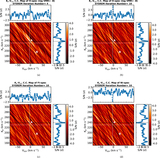
Caption: Figure 8.
Cross-correlation results between the M-dwarf model and five M-dwarf spectra, Barnard’s Star (black line), HD 95735 (blue line), Gl 752A (green line), HD 173739 (red line), and Proxima Centauri (brown line). The color of the label of the wavelength range also represents the order to which the CCD belongs. Note that the y-axis scale is not uniform, and thus the orders cannot be compared. The black dashed line is the rest-frame RV of each M-dwarf star, while the vertical blue dashed line in the first three orders of the blue CCD is the position of the CCF peak in those orders. The blue and red shaded panels show the badly shaped CCFs that are masked from the rest of the analysis (bad). The gray shaded panel shows the masked order, due to heavy contamination by strong telluric lines (ht), in the later analysis.
Other Images in This Article
Show More
Copyright and Terms & Conditions
© 2017. The American Astronomical Society. All rights reserved.