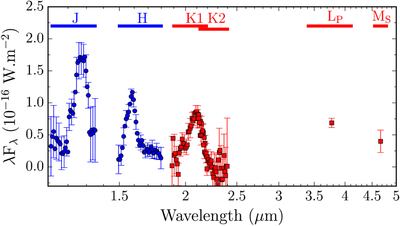
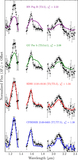
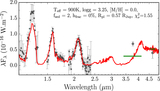
Image Details

Choose export citation format:

Characterizing 51 Eri b from 1 to 5 μm: A Partly Cloudy Exoplanet

  • Authors: Abhijith Rajan, Julien Rameau, Robert J. De Rosa, Mark S. Marley, James R. Graham, Bruce Macintosh, Christian Marois, Caroline Morley, Jennifer Patience, Laurent Pueyo, Didier Saumon, Kimberly Ward-Duong, S. Mark Ammons, Pauline Arriaga, Vanessa P. Bailey, Travis Barman, Joanna Bulger, Adam S. Burrows, Jeffrey Chilcote, Tara Cotten, Ian Czekala, Rene Doyon, Gaspard Duchêne, Thomas M. Esposito, Michael P. Fitzgerald, Katherine B. Follette, Jonathan J. Fortney, Stephen J. Goodsell, Alexandra Z. Greenbaum, Pascale Hibon, Li-Wei Hung, Patrick Ingraham, Mara Johnson-Groh, Paul Kalas, Quinn Konopacky, David Lafrenière, James E. Larkin, Jérôme Maire, Franck Marchis, Stanimir Metchev, Maxwell A. Millar-Blanchaer, Katie M. Morzinski, Eric L. Nielsen, Rebecca Oppenheimer, David Palmer, Rahul I. Patel, Marshall Perrin, Lisa Poyneer, Fredrik T. Rantakyrö, Jean-Baptiste Ruffio, Dmitry Savransky, Adam C. Schneider, Anand Sivaramakrishnan, Inseok Song, Rémi Soummer, Sandrine Thomas, Gautam Vasisht, J. Kent Wallace, Jason J. Wang, Sloane Wiktorowicz, and Schuyler Wolff

2017 The Astronomical Journal 154 10.

  • Provider: AAS Journals

Caption: Figure 4.

Final spectral energy distribution of the directly imaged exoplanet 51 Eri b. The new K1 and K2 GPI spectra along with the updated LP and new MS photometry are shown with red squares. The GPI J and H spectra, updated to account for the revised stellar flux, from the discovery paper (Macintosh et al. 2015), are plotted with blue circles. The filter extent is shown with the horizontal line over each band. To reduce crowding in the spectra, the errors for one out of every two data points are plotted. The data used to create this figure are available.

Other Images in This Article

Show More

Copyright and Terms & Conditions