Image Details
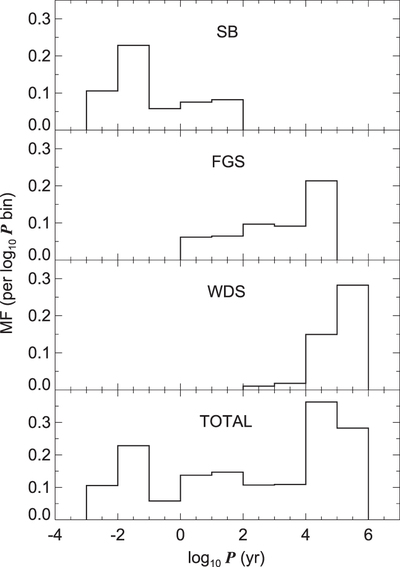
Caption: Figure 4.
Histograms of the multiplicity fraction (MF) plotted as a function of orbital period. From top to bottom, successive panels show the distributions for the spectroscopic binary (SB), Fine Guidance Sensor (FGS), Washington Double Star (WDS), and total samples, respectively.
Other Images in This Article
Copyright and Terms & Conditions
© 2015. The American Astronomical Society. All rights reserved.
Copyright ©
2026 Astronomy Image Explorer. All Rights Reserved.