Image Details
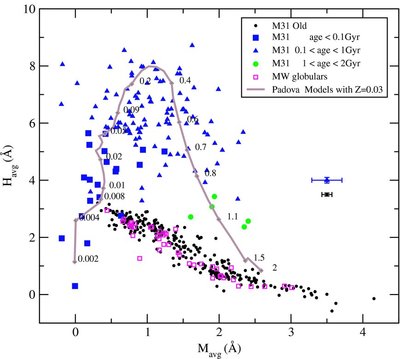
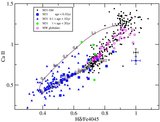
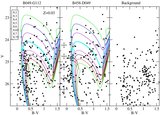
Caption: Figure 7.
M avg vs. H avg for M31 cluster spectra, with different types identified. Model indices derived from SB99 models using Padova Z = 0.03 isochrones are also shown as a solid curve. Ages in Gyr are marked at selected areas along the curve. Median error bars are shown on the right for young and old clusters separately. The maximum errors on points in this plot are 0.45 for M avg and 0.19 for H avg.
Other Images in This Article
Show More
Copyright and Terms & Conditions
© 2009. The American Astronomical Society. All rights reserved.
Copyright ©
2026 Astronomy Image Explorer. All Rights Reserved.