Image Details
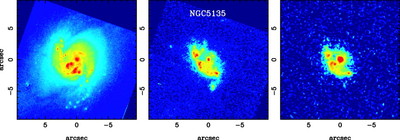
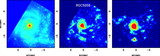
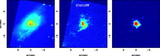
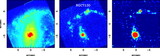
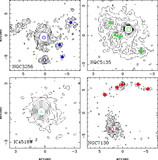
Caption: Fig. 1.
Left: HST NICMOS 1.1 μm continuum emission images except for NGC 3256, which is at 1.6 μm Middle: HST NICMOS continuum‐subtracted Paα line emission. The HST images, except those of NGC 3256 (see Alonso‐Herrero et al. 2002), are from AAH06. Right: Gemini/T‐ReCS N‐band images, except for NGC 3256, which is the narrowband 8.7 μm filter, for approximately the same FOV as the NICMOS imaging. The images have been smoothed with Gaussian functions with ﹩\sigma =1{\mbox{--}} 1.5﹩ pixels. All the NICMOS images were taken with NIC2 with a 0﹩\farcs﹩076 pixel﹩^{-1}﹩ plate scale. North is up, and east is to the left.
Other Images in This Article
Copyright and Terms & Conditions
© 2006. The American Astronomical Society. All rights reserved. Printed in U.S.A.