Image Details
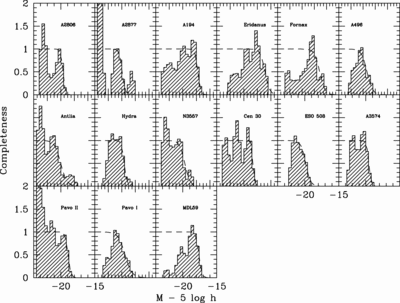
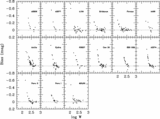
Caption: Fig. 3.
Absolute magnitude completeness histograms for each of the In+ cluster sample. The dashed lines show the smooth fits to the histograms used in our Monte Carlo simulations. The template clusters are ordered by right ascension and separated into Northern Hemisphere (top) and Southern Hemisphere (bottom) objects.
Other Images in This Article

Show More
Copyright and Terms & Conditions
© 2006. The American Astronomical Society. All rights reserved. Printed in U.S.A.
Copyright ©
2025 Astronomy Image Explorer. All Rights Reserved.