Image Details
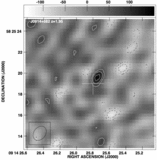
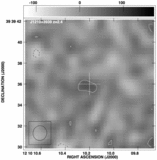
Caption: Fig. 1.
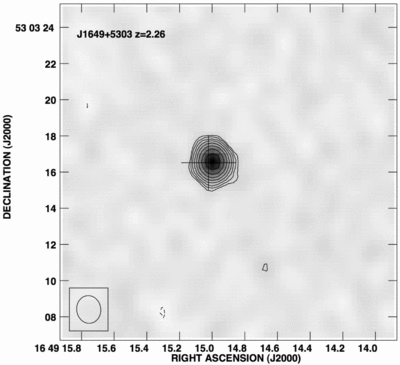
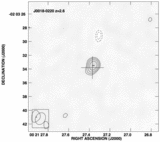
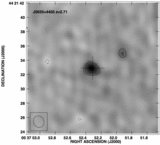
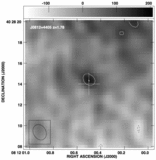
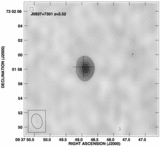
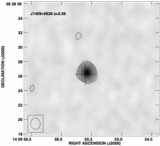
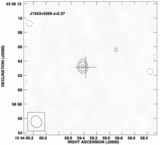
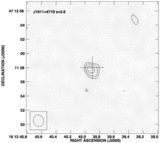
Images at 1.4 GHz of the sources detected and discussed in this paper. The FWHMs of the Gaussian‐restoring beams are shown in the insets in all panels. Contour levels (solid lines) are a geometric progression in the square root of two starting at 2 σ, with σ listed below (σ corresponds to the measured rms on the image). Three negative contours starting at −2 σ (dashed lines) are included. The central cross in each image marks the optical QSO location. (a) J0018−0220, ﹩\sigma =17﹩ μJy beam−1; (b) J0035+4405, ﹩\sigma =16﹩ μJy beam−1; (c) J0812+4028, ﹩\sigma =27﹩ μJy beam−1; (d) J0937+7301, ﹩\sigma =21﹩ μJy beam−1; (e) J1409+5628, ﹩\sigma =23﹩ μJy beam−1; (f) J1543+5359, ﹩\sigma =19﹩ μJy beam−1; (g) J1611+4719, ﹩\sigma =19﹩ μJy beam−1; (h) J1649+5303, ﹩\sigma =19﹩ μJy beam−1; (i) J0914+582, ﹩\sigma =30﹩ μJy beam−1; (j) J1210+3939, ﹩\sigma =25﹩ μJy beam−1; (k) J1304+2953, ﹩\sigma =22﹩ μJy beam−1.
Other Images in This Article
Show More
Copyright and Terms & Conditions
© 2006. The American Astronomical Society. All rights reserved. Printed in U.S.A.