Image Details
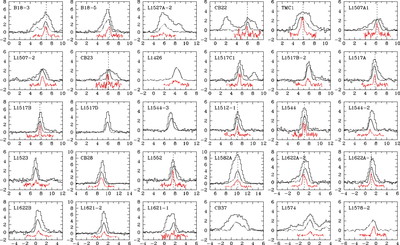
Caption: Fig. 1.
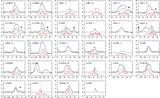
Spectra of 12CO and 13CO toward starless cores. The 12CO lines are shown in the histogram, and the 13CO lines are shown as solid lines. The x‐axis is radial velocity (km s−1) with respect to the local standard of rest, whereas the y‐axis is antenna temperature (K). As a result of frequency‐switching observations, a telluric 12CO line appears either in emission (filled circle) or in absorption (open circle). CS ﹩J=2{\mbox{--}} 1﹩ lines taken from Lee et al. (1999) including unpublished ones are also shown as solid lines for comparison. The CS lines are scaled up by a factor of 6 and shifted by 1 K. The dashed vertical lines indicate the systemic velocity derived from N2H+ line.
Other Images in This Article

Copyright and Terms & Conditions
© 2004. The American Astronomical Society. All rights reserved. Printed in U.S.A.