Image Details
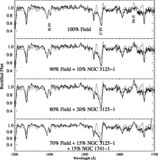
Caption: Fig. 1.
Far‐UV spectra of our sample clusters are presented with the best‐fit "He II free" Starburst99 model (described in the text) overplotted. The data and models have been smoothed by three pixels for clarity. Each panel shows the cluster spectrum (thick black line), the best‐fitting model spectrum (gray line), their residual (thin black line), and the formal errors (dotted lines). The rest wavelength of the He II 1640 line is marked with a dashed line. Note that for galaxies for which the LMC/SMC metallicity Starburst99 model was used to determine the age and extinction, we show the solar model (at the same age) redward of λ1600.
Other Images in This Article
Copyright and Terms & Conditions
© 2004. The American Astronomical Society. All rights reserved. Printed in U.S.A.